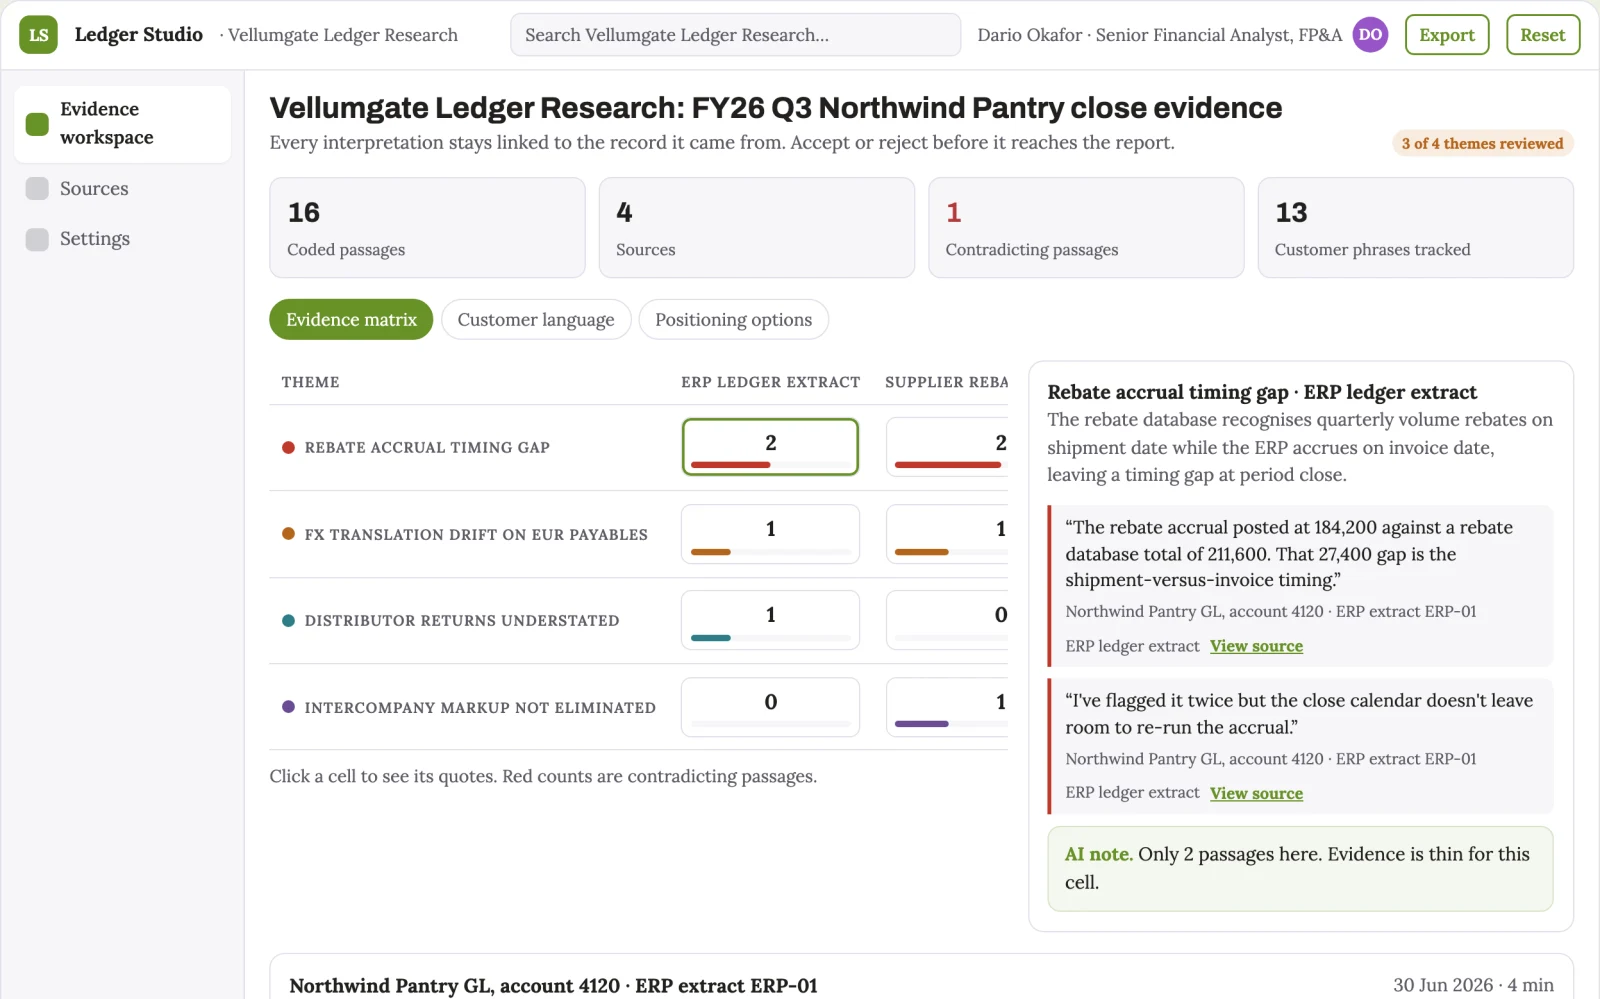
Connected spreadsheet analysis and reporting workspace
Reduce manual spreadsheet work while keeping analysis evidence-backed and reviewable.
- For
- Analysts and finance teams working with large or connected datasets
- Solves
- Large or connected datasets sit across files, databases and apps, so analysis and reporting take repeated manual spreadsheet work.
- Delivers
- Reviewer-approved analysis and reports linked to source records
- Built in
- about 5 weeks of creation time, MVP in 6 days
- Investment
- $12,500 for the MVP, $42,500 for the full product
- Run it
- Inside your business, or as part of your offer to clients
What it does
Reduce manual spreadsheet work while keeping analysis evidence-backed and reviewable.
- Load large datasets into a spreadsheet layout.
- Connect external databases and apps for synced data.
- Extract data from PDFs, Excel files, CSVs and images.
- Generate spreadsheet formulas from a prompt.
- Clean, merge and transform datasets.
- Enrich datasets with added information.
- Research and autofill from permitted sources.
- Sort and organize data automatically.
- Build charts, graphs and interactive reports.
- Surface up-to-date insights for decisions.
- Support team collaboration on analysis.
- Learn user preferences for recommendations.
- Compare the reviewed result with the recorded baseline and value assumptions.
- Capture corrections and named-owner approval before consequential use.
- Export a versioned reviewer-approved analysis and reports linked to source records with source references and unresolved questions.
Everything these tools do, in one app
- Spreadsheet interface Lets users work with data in a familiar spreadsheet layout.Found in Gigasheet
- Large dataset handling Processes very large datasets, up to 1 billion rows in a single sheet.Found in Gigasheet
- No-code analysis Enables data analysis without writing code or SQL queries.Found in Gigasheet
- AI formula generation Automatically writes complex spreadsheet formulas from a prompt.Found in Sourcetable, CTRL Sheet
- Live data integration Connects to external databases and apps so data stays synced and up-to-date.Found in Sourcetable
- Data extraction from files Pulls data from PDFs, Excel files, CSVs, and images into the spreadsheet.Found in CTRL Sheet
- Data cleaning and transformation Cleans, merges, and transforms large datasets.Found in Gigasheet, Sourcetable
- Data enrichment Adds extra information to datasets to make them more useful.Found in Gigasheet, Sourcetable, CTRL Sheet
- AI research assistant Uses AI to pull in data from the internet and other sources to autofill spreadsheets.Found in Sourcetable, CTRL Sheet
- Interactive reports and visualizations Creates charts, graphs, and reports to turn raw data into clear insights.Found in Sourcetable, CTRL Sheet
- Intelligent data sorting Automatically organizes and sorts data within the spreadsheet.Found in CTRL Sheet
- Real-time insights Provides up-to-date insights to help users make decisions quickly.Found in CTRL Sheet
- Collaboration features Allows teams to work together on data analysis.Found in Gigasheet
- Learns user preferences Improves recommendations and automation over time based on user behavior.Found in CTRL Sheet
What goes in, what comes out
- Permitted files
- Database connections
- App data

AI drafts, people review. Evidence-backed analysis and reporting workspace.
- Reviewer-approved analysis
- Reports linked to source records
How it works
The workflow
- InStart with
Permitted files, database connections and app data
- 1
Confirm the buyer's problem and scope
- 2
Collect permitted files
- 3
Database connections and app data
- 4
Then follow this sequence: 1
- OutFinish with
Reviewer-approved analysis and reports linked to source records
AI does the heavy lifting, people stay in charge
Use AI to interpret permitted inputs, suggest structured mappings and generate candidate outputs for the stated task modules. Use deterministic code for arithmetic, schema validation, hard constraints and reproducible tests. Review source-linked explanations and uncertainty before accepting results. Final figures, reconciliations and reporting decisions remain analyst and finance review. A model suggestion is never a verified fact, professional decision or authorization to act.
What your team sees
Primary screens: Data connection and import, Editable analysis workspace, Report and delivery. Use a thumbnail gallery for datasets and reports, a large central spreadsheet canvas, and a right-hand panel for sources, formulas and comments. Let users compare versions side by side. Display draft, changes requested and approved states. Provide a client preview link with comments anchored to the relevant cell or chart. Make the task-specific outcome reviewer-approved analysis and reports linked to source records visible beside its evidence, review state and value baseline.
Accounts and administration
Project ownership, dataset versions, client comments, approval states, usage allowances, revision limits, download history and a rights record for supplied material. Add organization access boundaries, named reviewers, usage caps, data retention controls, export logs and explicit approval for external actions.
Integrations and data access
Client-owned files, authorized database connections and permitted app data. Cloud storage, spreadsheet import/export and reporting destinations. Start with file exchange and validate destination specifications before promising direct publishing. Start with authorized file exchange. Validate current provider access, usage rights and schema behavior before promising a connector.
How we build it
We build with our own AI software development factory, so most implementations take days to a few weeks of creation time, not months. You see working software at every step, and exact timing depends on availability.
- 1
Scoping call
Day 1Thirty minutes on your process, your data and how you want to run it: for your own team, or for your clients. You get a fixed scope and price for the MVP.
- 2
MVP
6 daysOne buyer segment, one recurring use case; first modules: load large datasets into a spreadsheet layout; connect external databases and apps for synced data. Manual review in the loop. Built by our AI software factory.
- 3
Paid pilot
7 daysAccounts, roles, review states, audit trail and the first integration, hardened for two to three paying pilot customers.
- 4
Full product
3 weeksSelf-serve onboarding, billing, monitoring and the wider integration set.
- 5
Run and improve
MonthlyWe host, monitor and improve it for a fixed monthly fee, or hand it over to your team. How the retainer works.
Why we start with an MVP
An MVP, or minimum viable product, is the smallest version that your users can actually work with. It is not a cheap version of the full solution. It is a test, built to answer the questions that decide whether the rest is worth building.
- Pick the riskiest assumption. Here: will analysts and finance teams working with large or connected datasets use it to solve "large or connected datasets sit across files, databases and apps, so analysis and reporting take repeated manual spreadsheet work"?
- Build only what tests it. One team, one use case, a few core modules. People do the rest by hand for now.
- Run a paid pilot. Agree quality and outcome thresholds before the pilot using this measure: Accepted reports per analyst hour and corrections after report approval.
- Measure, then decide. Track accepted reports per analyst hour and corrections after report approval; accepted-output rate; material error rate; reviewer correction time; actual repeat purchase. Then expand, change course or stop, with evidence instead of opinions.
MVP scope for this solution. Pilot scope: One approved file and connection set; final figures, reconciliations and reporting decisions remain analyst and finance review. Implement one approved input format, a bounded representative case set and the first two task modules: load large datasets into a spreadsheet layout; connect external databases and apps for synced data. Support the third module with operator review: extract data from PDFs, Excel files, CSVs and images. Include source references, corrections, basic organization access, approval states, export and value measurement. Use managed operator assistance for unresolved exceptions. The cost estimate covers this narrow prototype, not unrestricted multi-tenant scale, complex production integrations, specialist certification or physical operations.
After the MVP. Once paid pilots prove usefulness, automate repeatable reviewed steps and add one verified source integration. Expand supported inputs and case volume only after new evaluation cases pass. Build reusable customer configurations and recurring value reports around reviewer-approved analysis and reports linked to source records. Retain the explicit scope boundary: One approved file and connection set; final figures, reconciliations and reporting decisions remain analyst and finance review.
What the build depends on. Data upload and preview, asynchronous processing jobs, editable version history, reviewer access and tested export formats. High-fidelity analysis requires analyst and finance review. Obtain representative authorized cases, baseline measurements, qualified reviewers and a buyer-side decision owner. Specific limitation: One approved file and connection set; final figures, reconciliations and reporting decisions remain analyst and finance review.
Investment
A planning range to start the conversation, not a quote. You pay per phase, so you can stop after the MVP.
- Phase 1
MVP
One buyer segment, one recurring use case; first modules: load large datasets into a spreadsheet layout; connect external databases and apps for synced data. Manual review in the loop.
- Phase 2
Paid pilot
Accounts, roles, review states, audit trail and the first integration, hardened for two to three paying pilot customers.
- Phase 3
Full product
Self-serve onboarding, billing, monitoring and the wider integration set.
Indicative total, MVP to full product$42,500about 5 weeks of creation time · start with the MVP from $12,500
Running costs per month
A rough indication of monthly hosting and AI model costs once it is live, not tested. Real costs depend on usage, file sizes and the models chosen.
| Stage | Hosting and infrastructure | AI usage | Total per month |
|---|---|---|---|
| MVP and paid pilotabout 3 customers | $50–$100 | $80–$160 | $130–$260 |
| Full productabout 50 customers | $190–$380 | $880–$1,750 | $1,070–$2,130 |
Run it or resell it
For your own team
Analysts and finance teams working with large or connected datasets run it inside the business: permitted files, database connections and app data in, reviewer-approved analysis and reports linked to source records out, reviewed by your people.
As part of your offer
Agencies, consultancies and software companies can offer it to their own clients under their brand. We build and maintain it; you sell and deliver it.
Your brand, or this one
Run it under your own brand, or start from this concept style.
- primary
#689127 - accent
#9754c9 - surface
#ecf1e4 - ink
#22201e
- Headings
- Archivo
- Text
- Lora
- Voice
- Exact, sober, trustworthy
Selling it to your own clients: the go-to-market playbook
Pricing to test
Test a USD 300-1,500 fixed pilot for one defined dataset package. Offer a monthly analysis allowance after repeat demand. Quote complex integrations or specialist reporting separately. These are test prices, not market benchmarks. Package the initial sale as one bounded reviewer-approved analysis and reports linked to source records. Recurring fees must specify volume, review depth and integration support. For exchanges, test a disclosed coordination or successful-service fee rather than holding customer funds. Reprice only after measuring real delivery labor; platform-build cost is separate from a commercial pilot fee.
Message to test
Reduce manual spreadsheet work while keeping analysis evidence-backed and reviewable. Demonstrate a concrete reviewer-approved analysis and reports linked to source records using the buyer's approved example and show the baseline, corrections and actual delivery effort.
Where to find buyers
Analysts and finance teams working with large or connected datasets professional communities; specialist consultants serving this buyer; permissioned partner introductions; practical demonstrations at relevant trade or practitioner events.
Lead magnet
A reviewed sample reviewer-approved analysis and reports linked to source records from a small authorized input set, with a transparent calculation of accepted reports per analyst hour and corrections after report approval and no promised savings.
The first 30 days
- Week 1: interview five analysts and finance teams working with large or connected datasets and inspect a recent example of large or connected datasets sit across files, databases and apps, so analysis and reporting take repeated manual spreadsheet work.
- Week 2: prepare a consented or synthetic demonstration of the three task modules.
- Week 3: seek one bounded paid pilot with agreed baseline and acceptance criteria.
- Week 4: measure accepted reports per analyst hour and corrections after report approval, reviewer effort and repeat-purchase interest. This is a demand-validation plan, not a thirty-day full-product delivery promise.
Paid pilot
Agree quality and outcome thresholds before the pilot using this measure: Accepted reports per analyst hour and corrections after report approval. Continue only if the buyer accepts the actual output, the intended job outcome improves without unacceptable errors, and measured delivery cost fits willingness to pay. Revise or stop if access is unavailable, qualified review cannot be provided, or apparent savings disappear after corrections and support. Use held-out cases when comparing model quality; use a properly reviewed comparison design before making causal claims. Record missing cases and negative results alongside successful outputs.
Success metrics
Accepted reports per analyst hour and corrections after report approval; accepted-output rate; material error rate; reviewer correction time; actual repeat purchase.
Retention and expansion
Repeat the workflow when the buyer again needs reviewer-approved analysis and reports linked to source records. Retain permissioned settings and reviewed examples, report realized value honestly, and sell increased volume or adjacent approved workflows only after contribution margin and quality remain acceptable.
Why clients would pick it
A reusable library of approved data mappings, transformation rules and review examples, together with reliable delivery for a narrow analytical niche. Build a permissioned library of representative task cases, reviewer corrections and verified operating constraints for analysts and finance teams working with large or connected datasets. Repeatable delivery and useful integrations matter more than access to a base model.
Alternatives and positioning
Gigasheet, Sourcetable and CTRL Sheet, plus manual spreadsheet work and BI tools. Compare this product with the buyer's present method on accepted reports per analyst hour and corrections after report approval. Offer a bounded paid workflow instead of claiming broad autonomous expertise. Market uniqueness and competitor coverage are not verified.
Main delivery costs
Compute for large datasets, storage, reviewer hours, client revision rounds and licensed source data. Additional initial validation requires representative authorized sample preparation, buyer interviews, buyer-side evaluation and bounded validation of reviewer-approved analysis and reports linked to source records. Track cost per accepted output, including correction work, unsuccessful cases and support.
Safeguards
Preserve data provenance, source attribution, calculation accuracy and usage permissions. Analysts and finance owners approve substantive changes and reporting scope. One approved file and connection set; final figures, reconciliations and reporting decisions remain analyst and finance review. Keep all consequential actions under authorized human control and do not fabricate missing inputs, permissions, professional judgments or market evidence.